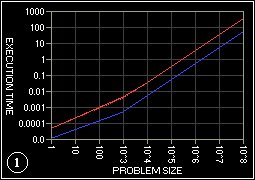
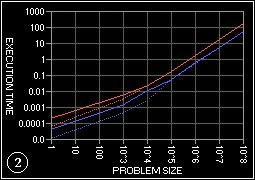
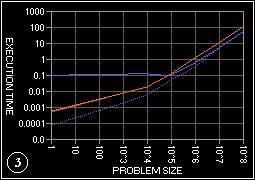
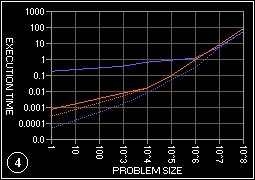
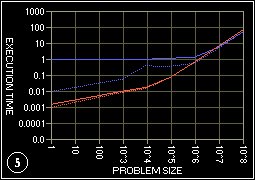
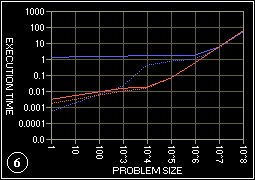
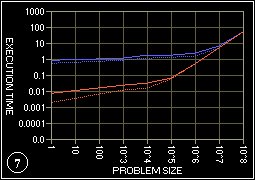
These graphs show how ENKI performs against Triscuit, my Pentium 200MMX file/internet server, both running the MPICH package. All benchmark times result from calculating PI via the integral method, a CPU-intensive algorithm with low interprocess communication overhead.
These graphs have log10 scaling along both axis.
The vertical corresponds to execution time, in seconds.
The horizontal corresponds to problem size, in number of intervals to
integrate over.
The blue lines are runtimes on Triscuit
The red lines are runtimes on ENKI.
The dotted lines are the minimum runtime obtained over many executions.
The solid lines are the average runtimes over many executions.
The number in the circle indicates the number of nodes used.